Ever since LexisNexis acquired the legal research startup Ravel last June, its plan has been to integrate Ravel’s caselaw visualization technology and data analytics into Lexis Advance. Earlier this year, I published a preview of the integration of the visualization technology. Today, LexisNexis is formally launching that integration and beginning to roll it out to customers.
The name given to this new tool within Lexis Advance is Ravel View. It looks and functions very much like Ravel did as a standalone platform, but with one significant difference — the Ravel visualizations now include Shepard’s citation information.
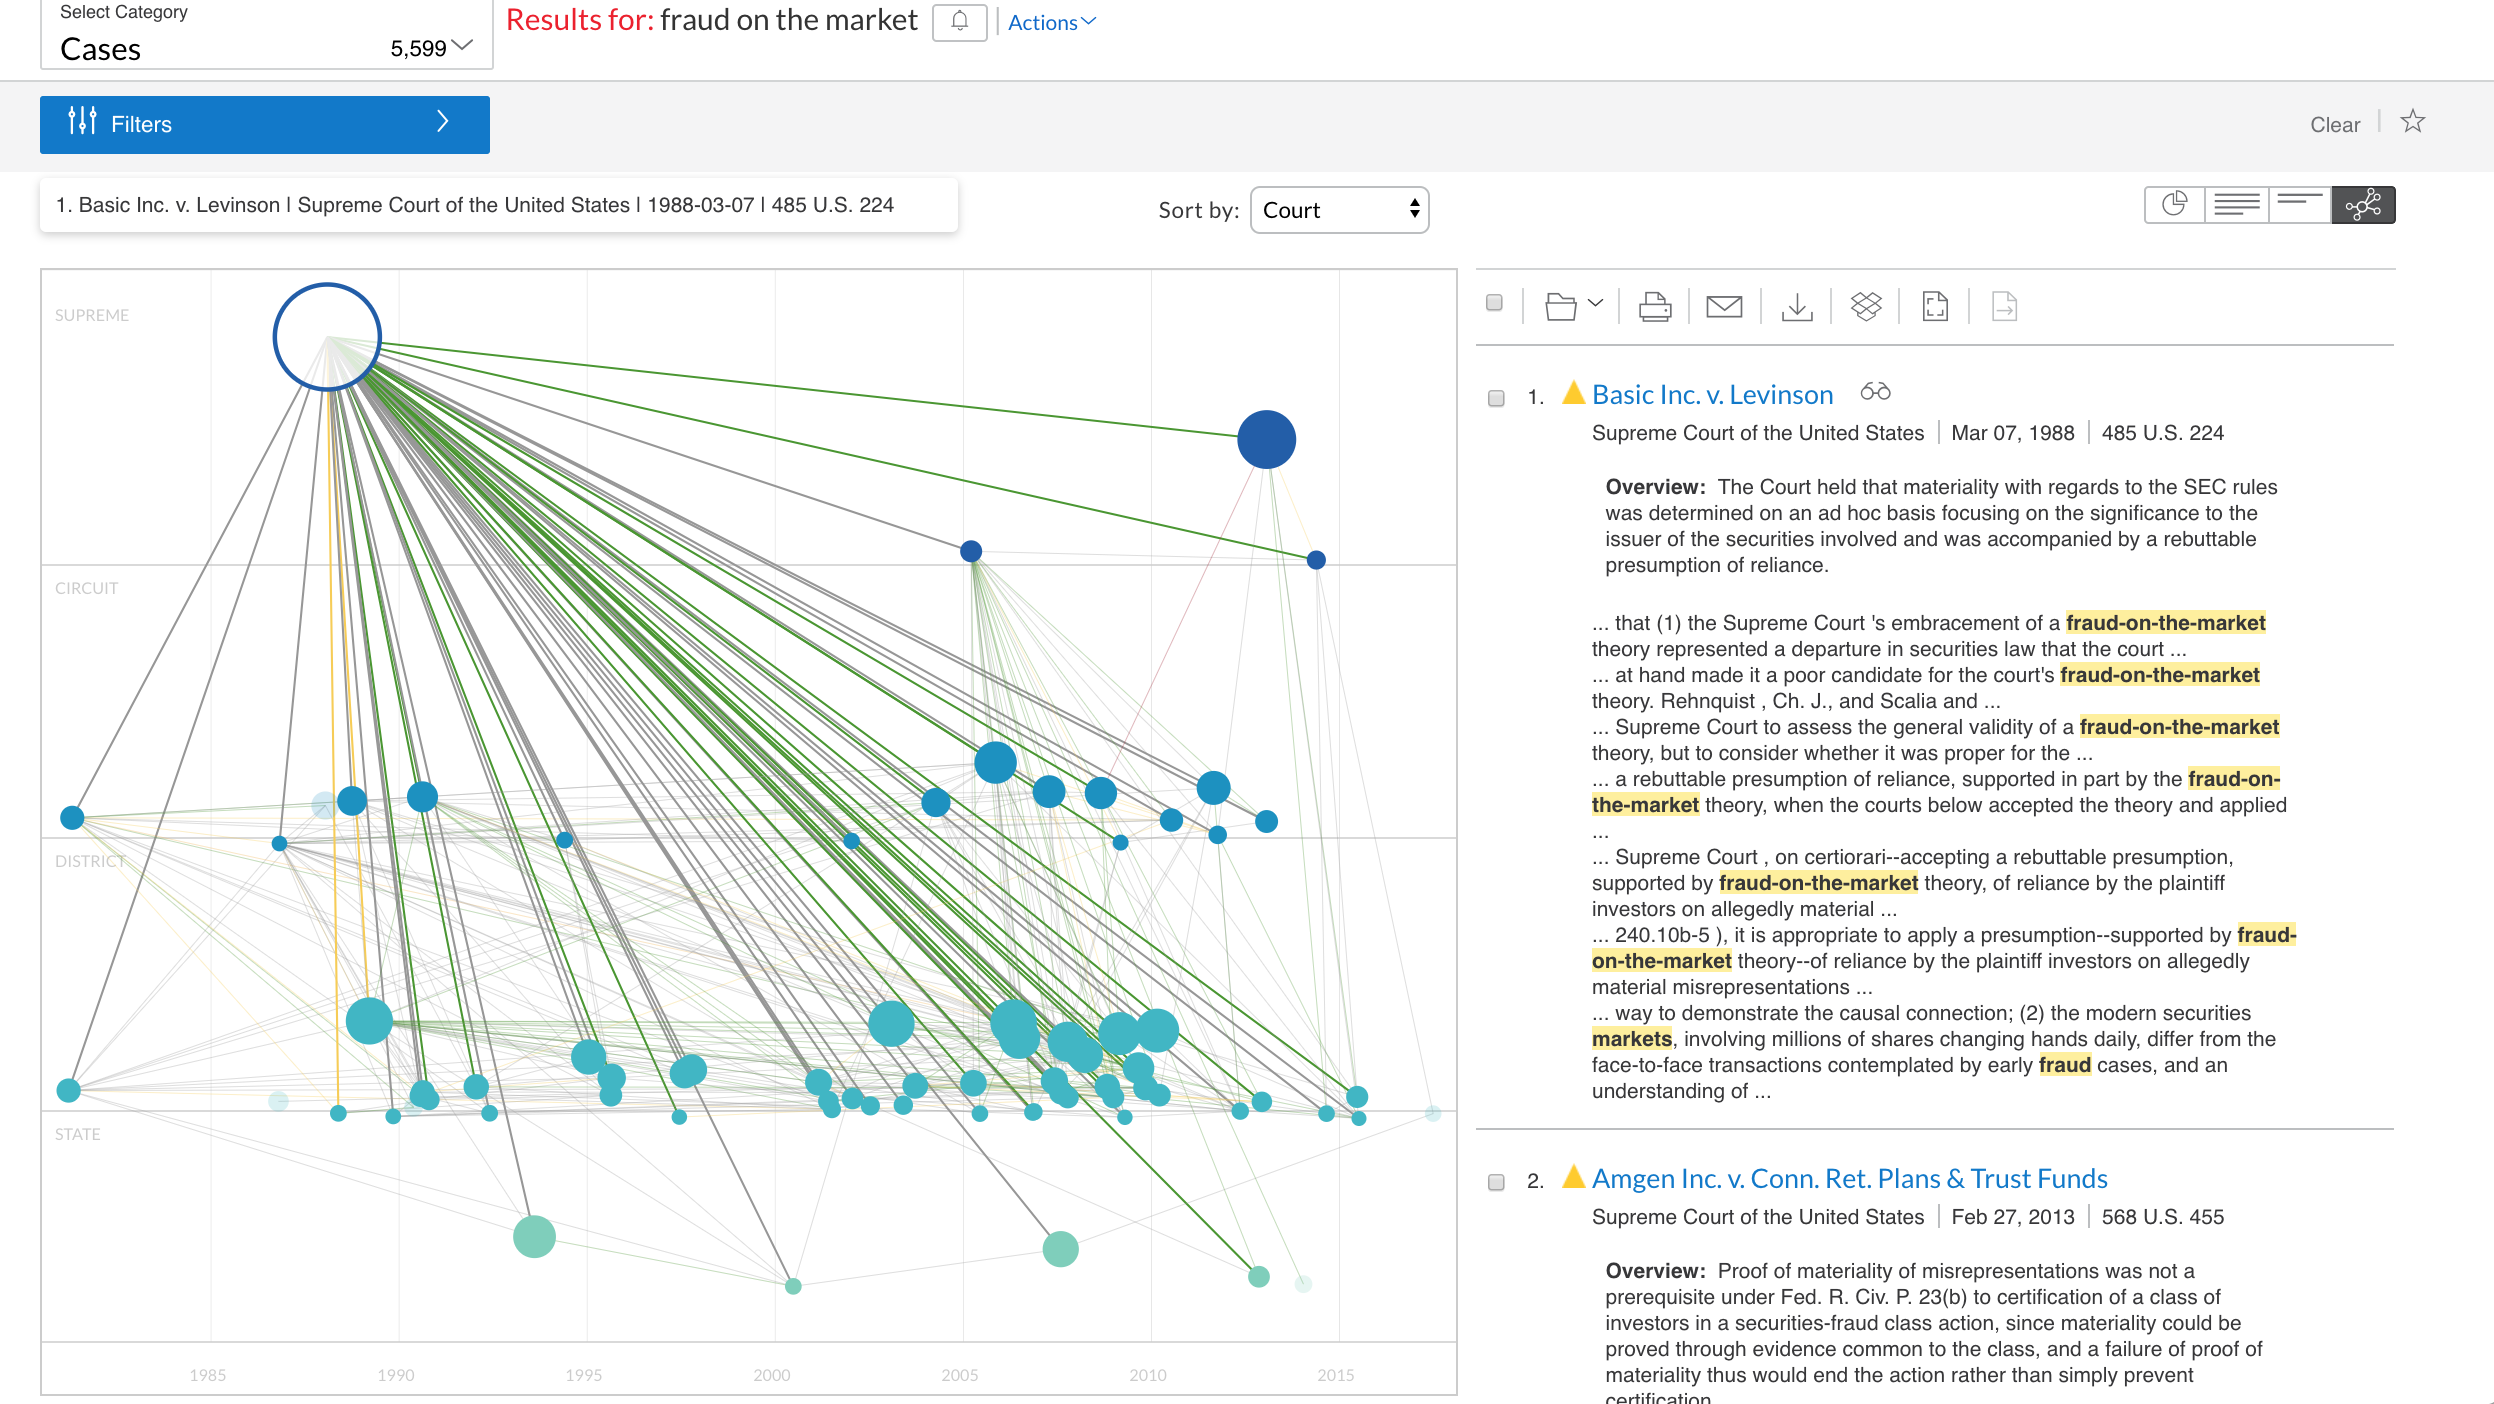
Ravel’s concept all along has been to display search results visually, along a cluster map that shows the relationships among cases and their relative importance to each other. This visual depiction provides researchers with a quicker understanding of the overall landscape of relevant cases and also helps identify the cases that are most important.

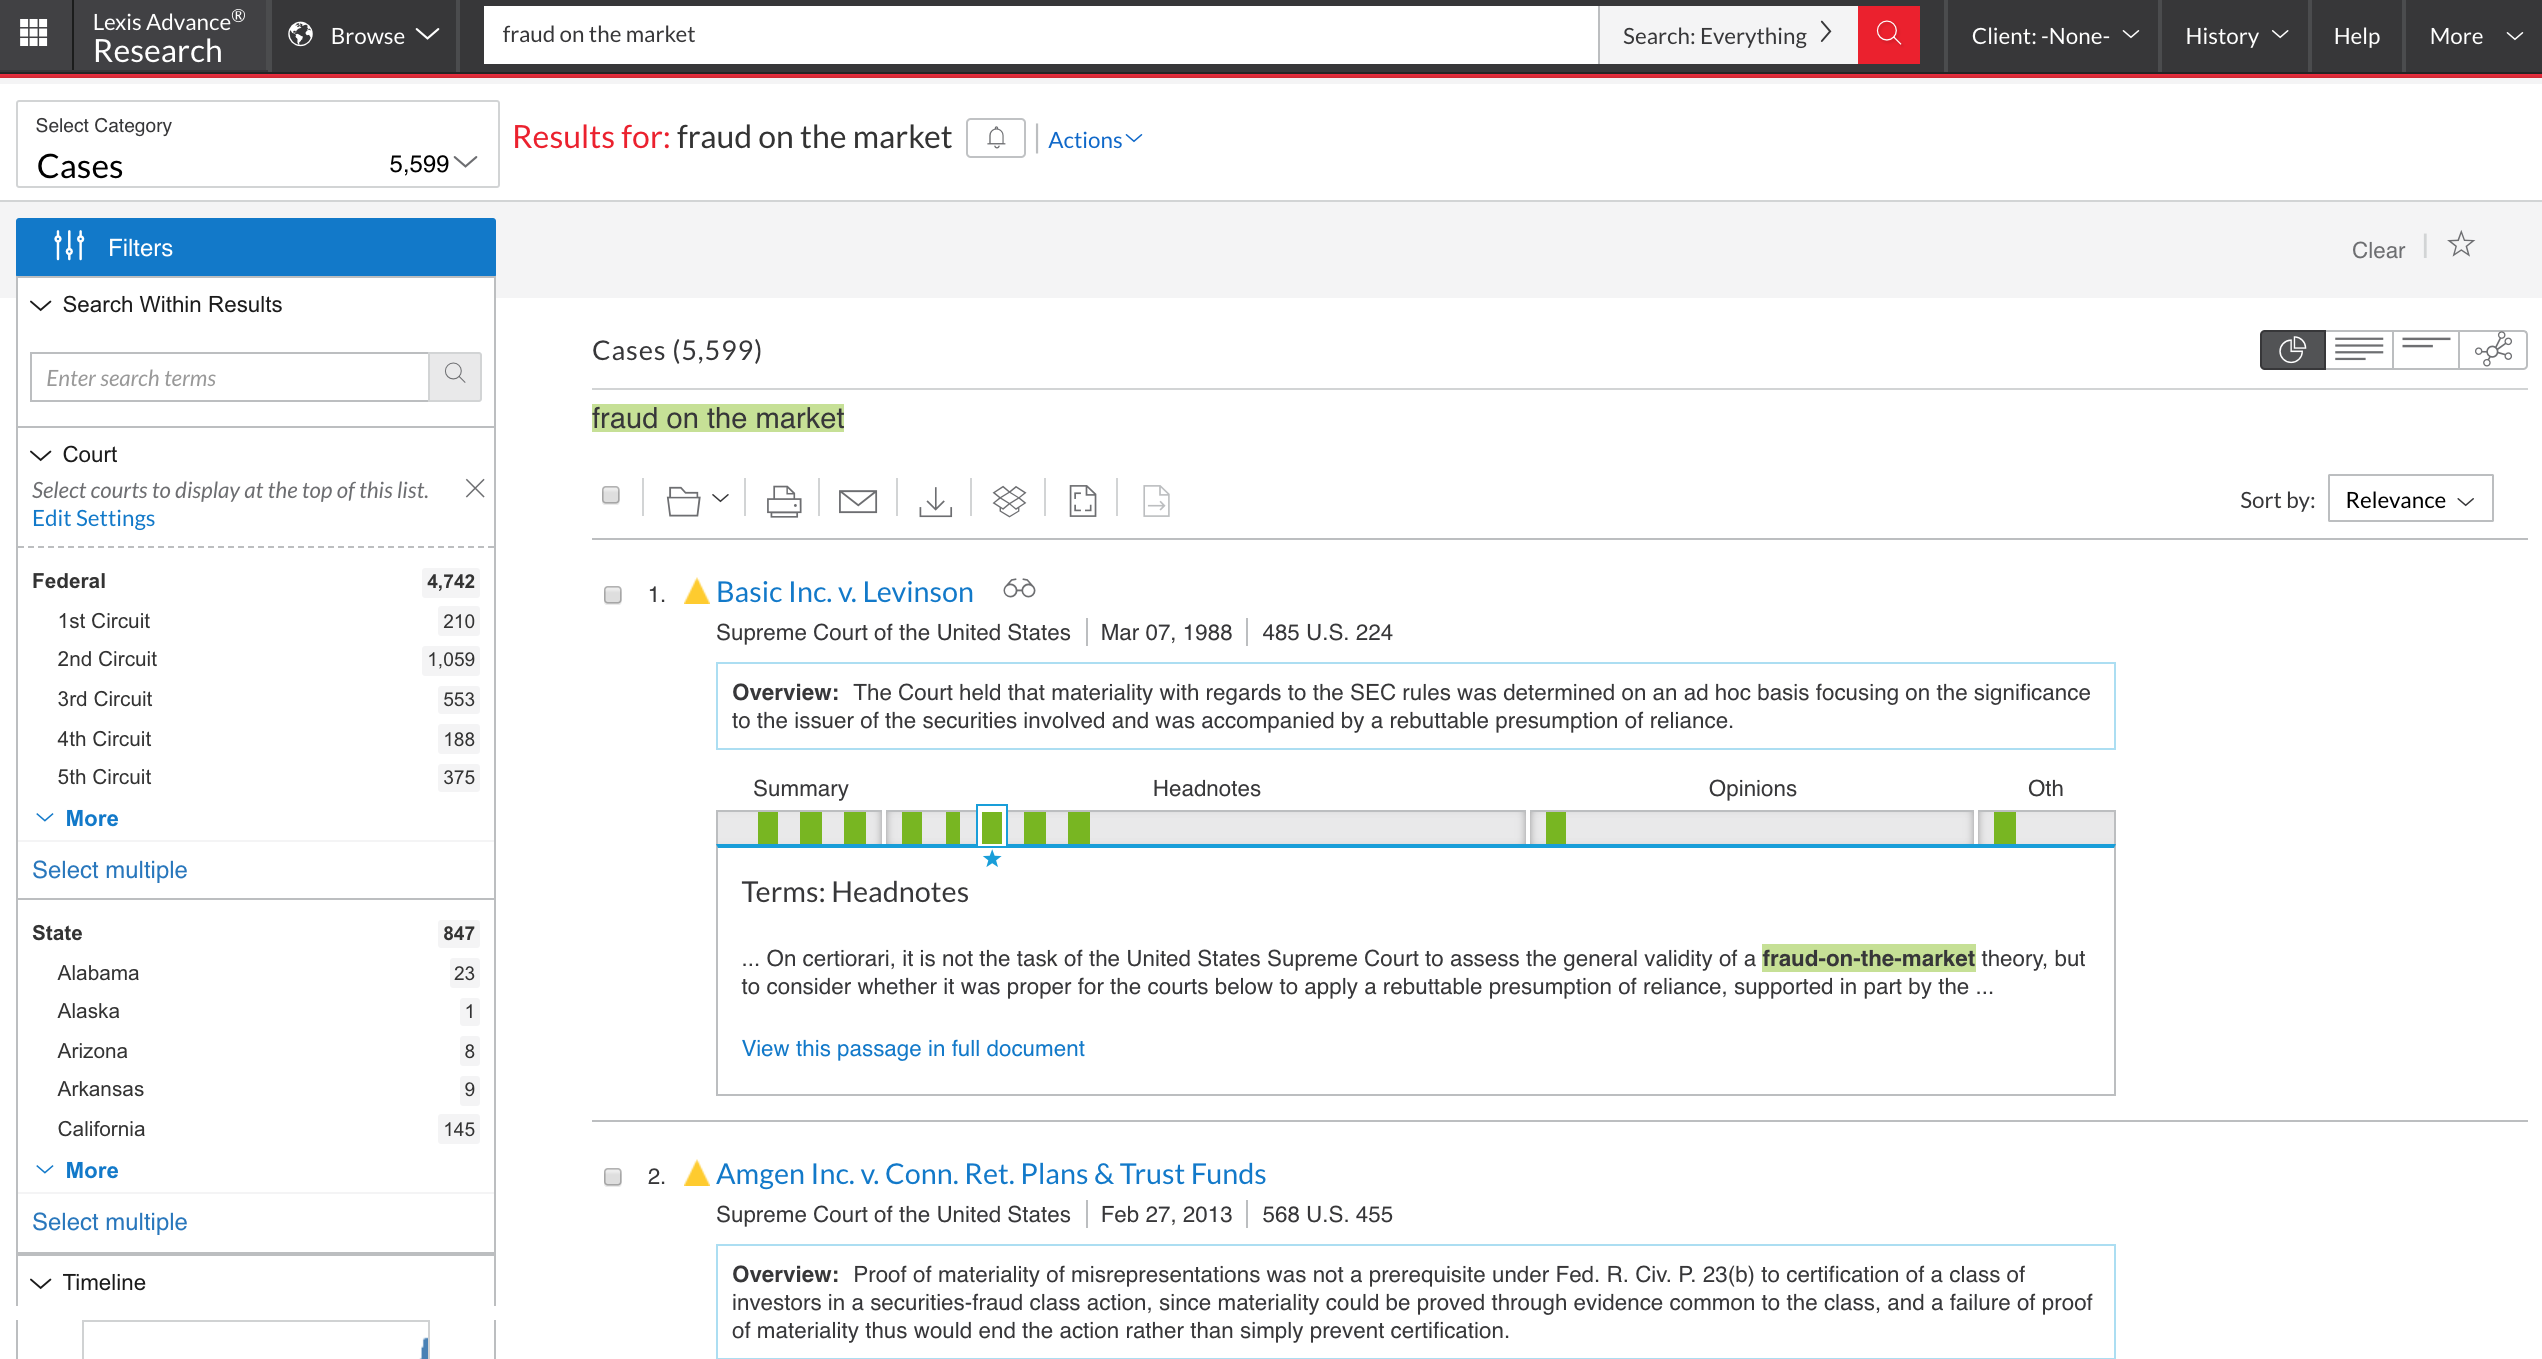
In the standard search-results view, click the icon in the upper right corner to switch to Ravel View.
Now in Lexis Advance, when a user conducts a query, the default results page will remain the traditional list of relevant cases. But the user will be able to click an icon in the upper rate of the screen to toggle the visual view, which displays the cluster map on the left side of the screen and the list of cases on the right.
Ravel View maps the top 75 cases relevant to the user’s search. Each case is represented as a circle, with lines between circles showing the citations between cases. This visualization shows:
- Citation frequency. The bigger the circle, the more frequently that case has been cited by other cases, a measure of its importance.
- Chronology. Ravel View maps cases across time, revealing trends and patterns in the development of precedent.
- Jurisdiction. The vertical axis shows the Supreme Court at the top, followed by federal and state courts below. This shows the governing relationships among cases based on their court hierarchy.
- Relevance. The higher a circle appears within each jurisdiction band, the more relevant the case is to the search.
When a user clicks on any circle, Ravel View displays the case name and citation relationships, and elevates the case to the top of the search results in the right panel so users can read the full description.
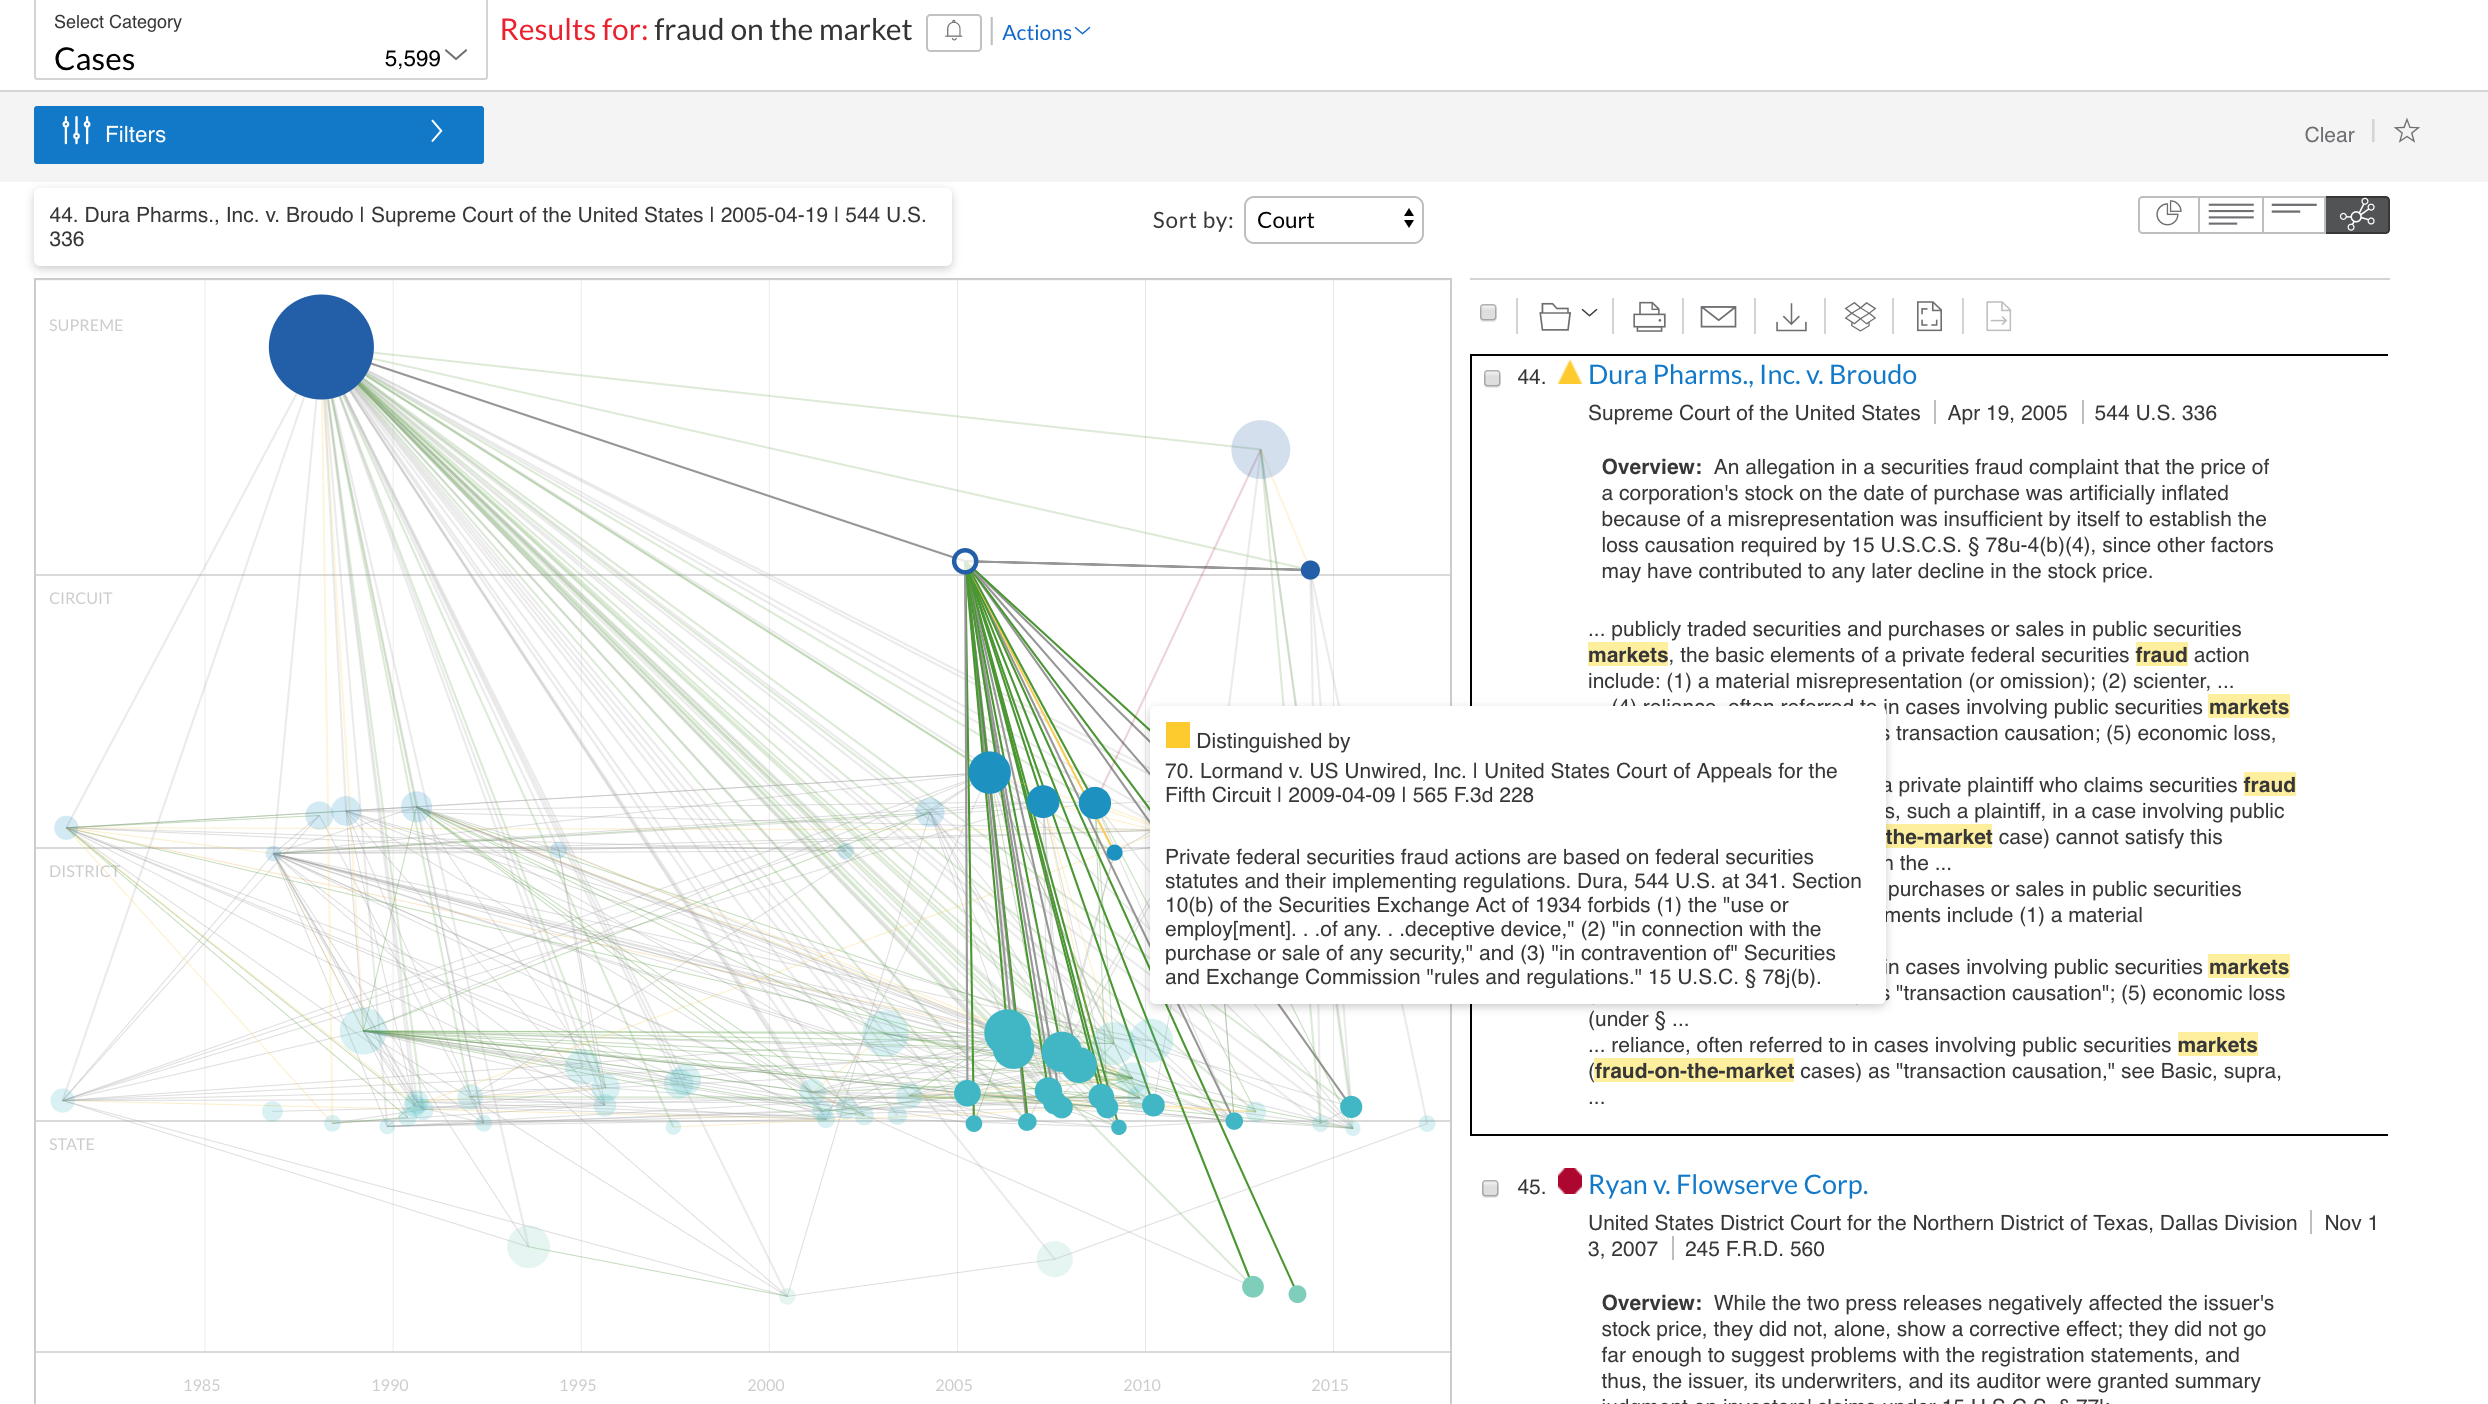
The incorporation of Shepard’s comes by way of the lines connecting each case. The lines are colored green, yellow or red to correlate to Shepard’s signal colors for positive and negative treatments. By hovering over a line, the user can display the language from the citing case that illustrates why Shepard’s assigned that treatment.
Ravel View will become available to every Lexis Advance subscriber on a phased-in basis over the next couple of weeks. By mid-July, it should be available to everyone.
Ravel CEO Daniel Lewis, who conceived the visual legal research platform while a second-year student at Stanford Law School, told me earlier this week that he is particularly excited about the integration of the Shepard’s citator information into Ravel’s visualizations.
“The highlight is the cool combination of taking the technology we had and adding it to the content and expertise that Lexis has to create this mashup,” he said.
Still to come is the integration of Ravel’s analytics into Lexis Advance. Ravel’s suite of analytics included court, judge and case analytics. The first of those integrations will come out over the next couple months, he said, in the form of a new product on the Lexis platform. That effort is being led by Ravel cofounder Nick Reed.
For now, Ravel continues to operate as a standalone platform. But once the integration is complete, Ravel’s customers will be transitioned to Lexis, Lewis said. “The things you liked in Ravel you will be able to do better in Lexis,” he said.
 Robert Ambrogi Blog
